Western Regional Climate Center
ENSO Climate Risk
Purpose of ENSO Risk Maps
Climate impacts are generally manifested through extremes. As El Niño-Southern Oscillation (ENSO) has been associated with numerous impacts on land management, quantifying the link between ENSO and extremes may help alleviate detrimental impacts and provide interagency benefit. Attributing a single storm to ENSO is rather challenging; however, on monthly and seasonal time scales, ENSO has been shown to have a noted influence on climatic extremes. We define extremes for temperature (warm/cold) and precipitation (wet/dry) as months in the upper 80th/lower 20th of the historical distribution. In other words, a cold month happens on average in one of every five years.
Data
Monthly temperature and precipitation data are from the PRISM (Parameter-elevation Regressions on Independent Slopes Model) dataset at a 4-km horizontal resolution. PRISM is adept in mapping climate in complex topographic settings and provides a more detailed view of management parcels compared to climate divisions. ENSO is defined using the monthly SOI index from the University of East Anglia, whereby El Niño months are qualified by SOI < -1, La Niña months are qualified by SOI > 1. Concurrent relationships between SOI and monthly climate extremes are examined over the period 1895-2008.
ENSO Risk
Climate risk assessment asks the question as to whether the odds of experiencing an extreme wet month during El Niño conditions differs significantly from the odds of experiencing a wet month historically. For instance, if a wet month occurs during 40% of all El Niño periods, this would imply a doubling of the risk (wet months are considered to occur 20% of the time). To illustrate, a scatterplot of March temperature for a grid point in the Cascades in Washington state is plotted versus SOI. The horizontal blue and red dashed lines denoted the 20th and 80th percentile values for March temperature, delineating the cold and warm extremes. The solid vertical lines denote the threshold for El Niño (SOI < -1) and La Niña (SOI > 1). For this example, the odds of experiencing a warm year during any given year is 20%; however, we can see that during El Niño conditions a warm year occurs about 48% of the time (upper-left hand corner)- a +140% increase in risk. By contrast, the odds of experiencing a cool year during El Niño is substantially reduced from the expected reduced – a 80% decrease in risk (lower-left hand corner).

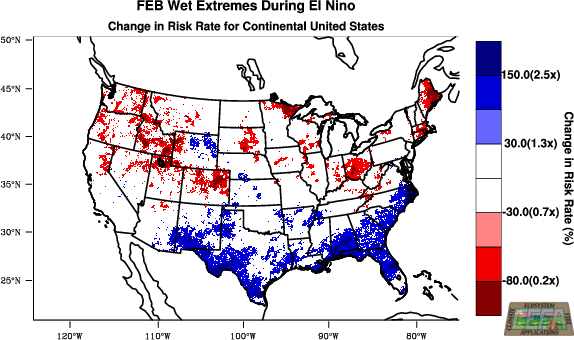
ENSO Risk Maps
A set of four maps for temperature (warm/cool) and precipitation (wet/dry) are produced for each month illustrating the conditional risk of climatic extremes during active ENSO periods. To assess whether results are statistically significant, bootstrap resampling is performed on each raster using a sample size of 10,000. Results are deemed significant when the 90% confidence interval of the resampled distribution does not include the null hypothesis of no change in risk from the expected value. Values that are colored are statistically significant, whereas white coloration indicates that the results are not significantly different than the null hypothesis.
The ENSO risk maps, sorted by warm/cool and wet/dry conditions, month or season, and by state, are available at the risk map selection page.
More Information
For additional discussion of the ENSO risk maps and how they were constructed, refer to this PDF document.